Monday, November 09, 2009

DIA & SPY End of Day Look

I generally stay out of discussions regarding the PPT and other shadow money that is moving around like an invisible hand to pick the pockets of small fry investors/traders. The existence or not of such forces, any of our jobs is to swim in the waters of our choosing.

Nevertheless, I do marvel that, for those who are short the market, their failure to realize that their pain is often the rocket propellant for the moves up. I know, I've been that pain from time to time, and I've a little pain going on now--but not teeth gnashing, weeping and wailing pain. A dull ache!

You know that one of my favorite little market books is G. C. Selden's Psychology of the Stock market. It is available through Google's books on line. You can find it available for download here. It is one of my favorite books. And though with a copyright of 1914, the commentary is fresh as ever.

The main point of their argument is
that the state of mind of a man short
of the market is radically different from
the state of mind of one who is long.
Their whole study, in such a conversation,
is the mental attitude of those interested
in the market. If a majority
of the volatile class of in-and-out traders
are long, many of them will hasten
to sell on any sign of weakness and
a decline will result. If the majority
are short, they will buy on any development
of strength and an advance may
be expected.

G. C. Selden, Psychology of the Stock Market, p. 11


I pulled charts on the DIA and SPY. Simple charts as I wanted to see some of the dynamics given today's thrust on low volume:


The oscillator (I use the Ulitmate Oscillator), is divergent from the price action in both indices. I look for these divergences, and I treat them as a heads up.

Positions: long SPY DEC puts and DIA NOV puts.

Sunday, November 08, 2009

GBG: Great Basin Gold

I own one gold stock---Great Basin Gold. It's an immaterial holding in my account, but I do have 2K shares @ $1.53 per share.

Here's a chart:

Click to make larger

This apex is my favorite thing to watch....the stock is fixin' to get ready to move. The news tomorrow will determine which way! Do note the volume patterns in this stock.

I'll pull a chart for you later in the week....to see how it pans (!!) out.

Position: Long GBG.

Gold Stocks Weekly Sector Chart

Gold continues to be at the forefront ofthe media. To enable your ease of review of charts in this sector, I have created this PDF.


Important note: When I create sector charts, it is for the purpose of providing readers with access to quick charts for many stocks in a sector that I feel may be broadly interesting. Because these are all-inclusive charts AND I do not mention individual stocks, I do not disclose any positions that I may have.

Transport Notes

Yesterday was a long day. I did a double run (Richmond - Springfield) for the animal transport. We had two older puppies, one cat and 6 tethered dogs. Pups, small dogs and cats are always in crates. Tethered dogs pose some interesting logistics because they are riding in passenger vehicles (sedans/SUV's) of various sizes. Temperament, then, plays a large part in who rides with whom. Abbott was an 8 month old massive boy. He needed to be in a car by himself. He appeared to my eye to have some Akita in him. We agreed that he would ride as a single tether in the other volunteer's Passat. One of my clients, who is also a very good friend, lets me use an extra company vehicle. It is a Ford Freestyle, and is perfect, as I can fold down all of the seats to make a 'van-type' back. Alpha dogs (male are female) have to be considered carefully. I had three females. Sapphire rode shotgun (passenger seat) with me. I had two 'humpy-boys', and I had to crate one of them, Stanley. I tried some MacGyver contraption with a gate to keep my other humpy boy, Sampson, in line. It worked until one of the girls, Dana, took a dump about 10 minutes into the trip. I had to get off the interstate. Unfortunately, my protective covering was short by 2 inches. She had a 6-inch diameter dump, and managed to hit the uncovered portion. I got up what I could and covered the spot with a towel. But there was that 'odor' wafting about the entire remaining passage. If you've ever ridden with a dog in your car, you know that they are very sensitive to changes in speed. So slowing down is some sort of 'signal' to them that they need to do a 'heads-up'. In this particular instance, I was stopped, and all heads and tails were up. That's when my MacGyver contraption failed. I'll not bore you with the details on the contraption, but it took me about 8 minutes to get everyone untangled--and somehow one of the leads which was clipped on the collar also managed to get clipped onto the gate (which is made from wire). So the dog basically was hung on the pen. Thankfully, none of them panicked, and none of them snipped or snarled at the other. They placed complete trust in me. Sapphire was interested, but she stayed in her seat. I decided that my other humpy boy, Sampson, would just have to be loose. Thankfully, he responded to my voice when I yelled at him to settle down when he had "other" ideas. Stanley in his crate was snarling (not sure why as he was a really sweet boy--probably didn't like being thwarted), and Claire snapped back at him. I yelled at her, yanked on her lead, and she stopped and came forward. 30 miles later, they were all asleep, each resting their head on the haunch of another with Sampson's head on the lip of the bed closest to the front. (He did not like my yelling at him or anyone else, and he was anxious to please). All in all I had to drive about 260 miles round trip. It makes for a long day. Sapphire was on her way to West Virginia to an adoptive home. Because your 'shotgun' passenger is so close to you during your trip, you always bond with them during the drive. This time was no different. Here are Dana and Sampson. I did not have pics from the shelter for Claire and Stanley.

Saturday, November 07, 2009

A Watershed Week

This week has been a bit of a watershed week for me. Some time ago when I was underwater with my work schedule (and this blog was a wasteland), I received an invitation from Seeking Alpha to be a guest contributor. I put it in an "action" file, but was still mulling over it in a vague sort of noncommittal way. They recently sent me another invitation within the last week. And....I received yet another invitation to write from another source.

Another 'thing' occurred this week, that was fortuitous in that it FORCED me to address my inertia regarding the first invitation (read: introspection). An appreciative reader mentioned my blog on another another blog (where the folks are serious traders and serious technicians), and I felt embarrassed. Why? Because in that company, I feel like my small insights, or whatever they might be, are not really 'worthy'. Here I was given a supreme compliment, and my reaction (inappropriately) was embarrassment.

You'll have to understand, too, that I'm that way in my work life and my personal. But dammit, if one doesn't learn how to be gracious about getting compliments, one will not get any! Modesty is a terrific trait, but it can be taken to an extreme. It took me six months to screw up enough courage (with the generous support and encouragement of an internet friend) to link my blog to my name.

While I promise NOT to become arrogant, I'm going to dispense with this posturing. I'm going to take a risk. That's what it is, isn't it? A risk that someone is going to read something I wrote and levy some harsh judgment--deserved or not. I guess what it comes down to is that I'm thin skinned!

I've been experimenting with you guys now for 1,296 posts (soon to be 1,297) over the last three years. We have a small, quiet corner of the world here, and I like that very much. It feels comfortable and intimate. My readers may not be legion, but they sure are loyal (and bashful, too!).

Thursday, November 05, 2009

Hunting for Volatility Squeezes

While I consider myself a serious student of the market, I don’t call myself a trader. But I do trade and have done so with reasonable success. This year, I incorporated a new dimension into my trading: volatility. Simply put, I’m buying when volatility is low, and I’m selling when volatility is high—and I’m doing so on charts that appear to be good candidates for long entries. I’ve not used it for short positions.

The point of this post is not to go into an in-depth analysis regarding volatility, but rather to introduce to you this concept and provide some actual examples. I think that you will have fun experimenting with it. I'll mention, too, that John Carter uses this in Mastering the Trade . But I cobbled it together for myself (after first experimenting with Donchian Channels) before reading his book. I believe it to be a book that belongs on most traders bookshelves.

Method: There are two technical indicators deployed: The Keltner Channel and Bollinger Bands. Like most indicators, both of these are measurements that are incorporating time and range of price movement that the user defines. For this method, I am specifically hunting for stocks that have the Bollinger Band nested INSIDE the Keltner Channel. Carter notes this as quiet periods..."period of reduced volatility and signals that the market is taking a significant breather, building up steam for its next move." For the Bollinger Bands, he uses 20 and 2, and for the Keltner Channels, 20 and 1.5. I started out using 10, as a parameter for both, and I've not changed it. But I wanted to share the parameters a vocational (Carter) rather than an avocational (me) trader utilized.

Now for four charts. I want to give a brief preamble. While many of you are technical traders, I mix macro fundamentals and sector fundamentals into my work. It's my quirk, and it works for me because of my learning style and my background. It points me in the direction I want to look and helps me assess risk.

The first three stocks were actual positions. I've been trading Chinese stocks long before it was fashionable to do so. The floats and price range may not suit many here, but the concept can be applied to any stock. It's worth noting that because this market fell hard, there were lots of attractive candidates in these long bases. The last is a contemporary example.

Here's SNEN. I liked them because they were in the compressed natural gas space in China (engine conversion units and stations). I also knew that they had a small balance sheet problem--so I took my money and ran. This stock is an example where I entered, sold on the volatility spike. Re-entered and re-sold on the volatility spike. No third time charm on this one because of the risk on the balance sheet. They are being bought by a shareholder.


Second is AZC. This stock is again a combination of fundamental (copper--they will supply 10% of the copper when one of their Rosemont site comes on board) and TA.

HPJ is another one. This one broke out along with the other lithium-ion battery producers.


I also wanted to give you a contemporary example in a more recognized name rather than the Chinese boneyard that I pick through. Here's LLY


The current price action suggest that it is fixin' to get ready to do something........

Here's the stock screen that I use on StockFetcher:

Close is above (XX)
AND Volume is greater than (XXXX)
AND Upper Bollinger(10) is less than Upper Keltner Band(10)
AND lower Bollinger(10) is greater than Lower Keltner Band(10)
and add column Bollinger %B(10,2) (I use this to order candidates from lowest band width to highest)

To put this post together, I didn't have to cherry pick through my stock entries to provide examples for you. It has proved to be a high probably trade and a richly rewarded trade. I will tell you that the hardest thing to do is to sell into the volatility explosion. And we know that doing the hard thing is often the right thing! I'm going to employ Market Sniper's excellent advice of holding onto a vestige of a former position--particularly if the stock gaps and goes like HPJ did. Naturally, any method you deploy must fit with your time, money and risk/reward parameters.


A Good Market View

Don't forget to visit http://www.ichimokucharts.com/ for a terrific overview of several markets!

Wondering Out Loud

It's always dangerous to wonder out loud, particularly as whatever one is musing is likely to abrade against the conventional view of things.

A blog participant on another blog mentioned this story (click to be transported).


While one respondent stated "that is a sure sign of a top in the market", my particular reaction (I'm not holding my reaction out as being more insightful) was this: "It seemed like a sure sign of a top in the bond market."

There seems to be lots of speculation about the fate of interest rates. I think that I can say with some conviction that there is no place but up. However, how far up and how soon is anybody's guess. Again, the 'epic' inflationista/deflationista debate which will be waged in the media and blogosphere. I'm not stepping into that fray other than saying one side or the other is in for a big surprise. How's that for neutrality! Equivocation! Teflon!

The second thing to take to address (if not take to task) is 'money on the sideline.' There seems to be much uninformed commentary based on that. I'll not add to the fray there either. I'll state these simple Truths which I believe are not subject to much credible debate:

Truth 1: Short term interest rates cannot fall further.
Truth 2: Long term interest rates can fall further (unlikely)
Truth 3: Long term interest rates can increase (likely)
Truth 4: The bond market is a very large enchilada, and due to low interest rates is not a very filling meal.


Yeah, I know that calling these "Truths" is stretching it a bit. And I know that stating that they are not subject to 'credible debate' is sort of impugning any criticism! That's not my style, so if you have an opinion, voice it.


But the point is this.... These Four Truths, I'm holding out to be self evident that the 'money on the sideline' is really the bond market. So while many who are on the wrong side of the trade are quick to point to the PPT and other unnatural forces that seem to thwart their every move or projection (these are omnipresent market forces always in existent--our job is to outnimble them!), I'm merely pointing out that the 800lb gorilla that represents money not previously in the stock market, is that money "sidelined" in the bond market.

So if you were a bond holder faced with an instrument denominated in a depreciating currency, earning a low return, subject to face value decline due to increasing interest rates what sort of repositioning would you do?

Wednesday, November 04, 2009

The Stinky Cheese Man

You know that, outside of some otherwise intemperate moments, that I'm a nice person. Some years ago, I was driving into town, and I decided to give an old man who I often see walking down the road a ride. It was raining, and I knew where he lived.

Unfortunately, when we get old, our olfactory senses diminish. Well, I'm not that old. He was drunk, his breath was bad, he smelled of urine and....yes, stinky cheese. I gave him a ride for about 8 miles. I thought that I was going to retch, and I wanted to be polite and not cough or make noises. The only other time I've smelled such stench on a person was when a morbidly obese woman was in the waiting room at a hospital. Anyone who has young kids will have had to make one of those late night trips to the pediatric urgent care. Clearly there were some crevices that she wasn't able to get to and the smell was worse than a dead skunk.

So what is my point? It's beginning to feel like to me that UBS is now the stinky cheese man of the banks. Here's a chart:

They were even downgraded by themselves to 'Sell' (From FINVIZ)


Here's an unflattering Bloomberg story. Click on graphic to read:

Non-stigmatized Commercial Real Estate Workouts

In my noodling around, I found this release which you can find at this link http://www.ffiec.gov/press/pr103009.htm [Edit: here's a link to the PDF (which I've not read!): http://www.fdic.gov/news/news/financial/2009/fil09061a1.pdf]

To my eye, it appears that they are trying to use motivation to facilitate loan workouts...meaning that we don't want you to NOT engage in workouts and will not penalize you for it. However, it does beg the question on transparency.

You know that my thinking is that 'they' are only trying to buy time to get this stuff worked out. Hopefully, 'they' will not run out of time.

---------------------------------------------------------------


Press Release
For Immediate Release October 30, 2009

Financial Regulators Adopt Guidance on
Prudent Commercial Real Estate Loan Workouts

The Federal Financial Institutions Examination Council (FFIEC) released a policy statement today supporting prudent commercial real estate (CRE) loan workouts. This policy statement, adopted by each of the financial regulators,1 provides guidance for examiners, and for financial institutions that are working with CRE borrowers who are experiencing diminished operating cash flows, depreciated collateral values, or prolonged delays in selling or renting commercial properties. The financial regulators recognize that prudent loan workouts are often in the best interest of both financial institutions and borrowers, particularly during difficult economic conditions. This policy statement details risk-management practices for loan workouts that support prudent and pragmatic credit and business decision making within the framework of financial accuracy, transparency, and timely loss recognition.


Financial institutions that implement prudent loan workout arrangements after performing comprehensive reviews of borrowers’ financial conditions will not be subject to criticism for engaging in these efforts, even if the restructured loans have weaknesses that result in adverse credit classifications.2 In addition, performing loans, including those renewed or restructured on reasonable modified terms, made to creditworthy borrowers, will not be subject to adverse classification solely because the value of the underlying collateral declined.


The policy statement includes examples of CRE loan workouts. The examples, provided for illustrative purposes only, reflect examiners’ analytical processes for credit classifications and assessments of institutions’ accounting and reporting treatments for restructured loans. The policy statement reiterates existing guidance that examiners are expected to take a balanced approach in assessing institutions’ risk-management practices for loan workout activities.


Policy Statement on Prudent Commercial Real Estate Loan Workouts (docx) (pdf)

Tuesday, November 03, 2009

Various

StockCharts lets you have 100 watch lists. Yep, I've used them all. It comes in handy when I want to look at stuff...

Here's my CleanTech list....most had a very good day

There's my little HPJ....

I do own ALTI--my little spec stock.

The market had a little something for everyone. I've not strung together too many back to back days in watching the market. I forgot how tedious it could be.

Of course, the FOMC looms over the market. People I respect are calling for the market to go higher. People I respect are calling for the market to go lower. Sounds like a toss up. I felt that this week would be news driven--and the tone of that news would set the tone for the market.

I'm fairly neutrally positioned. I do have some DEC 40's puts on ED. Here's a chart:


If the broad market goes up, I believe this position will pop out of the apex. If the broad market goes down, then I think I've a pretty decent short set up.

Hmm...You know that we are all about empiricism here. Accordingly, it is time to ask the Magic Eight Ball. Remember to click!


Who knew that the market could be so easy!

Excitement on the Tracks!

No doubt you have heard the news about Berkshire buying BNI.

I created a PDF of the rails if you wish to view them here.

Already this a.m. the rails are getting a lift, and that will squeeze shorts. Here's a list of the stocks in that industry sorted by short % of o/s shares.

Finally..... here's a list of the components of the DJ Transportation Index


Monday, November 02, 2009

Blog Hopping

I want give you a link to a post by Springhill Jack. It is here. It has some terrific charts that might be worth your review.

Don't let the title of the site, HotOptionsBabe.com, fool you. Serious work goes on there. AnnaMall was a contributor to the Evil Speculator, and a frequent poster on Slope of Hope. Like a bar, you see many of the same faces. The chart work by many of the contributors is fantastic. It is beyond my skill. I'll point you in more directions.

Third Time is a Charm

I watched with interest (I'm still recovering from the weekend's malaise--better but not 100%), the low of the day (LOD) of 131.08 get hit

Sunday, November 01, 2009

Utilities

I'm seeing lots of utility charts looking tired. Specifically, I see them at the peak of the price/volume (the volume by price sidebars you see me use in my charts).

If you care to look, I've created a PDF of the utility stocks. It's larger than most. Unlike the sector charts you see me do, this is on a daily v. weekly presentation. You can click through it quickly. I sat down with a beer, an English Setter and a cat and looked at a paper print out to make my annotations.

Dumb Money


As a 'retail' investor, I've always taken exception to being called dumb money. Stories such as this are a reminder that the root of all spectacular failures is hubris.

Click the above graphic to be transported to the story. Embrace your inner schadenfreudic feelings. You're entitled--but only for long enough to be vindicated and not long enough to be malicious. You can listen to this while you read.

Fixin to get ready to change comment handling...

This space has always been a little corner of the blogosphere. More of a personal writing space to help me concretize my thoughts as well as give others a peek into my occasional encounters with both dumbass and genius with a fair amount of time spent in the muddy waters of those two polarities.

Though the comment section is generally quiet, I think that I am going to convert the comments section to Disqus. I just did so on my test blog My test blog is my place where I try out my big ideas about blog design in case they fall into the dumb ass category! There's a bug in that not one but 3 comment lines show.

I appreciate that many like to stay anonymous, and I will allow that feature. The default avatar will be that of my beloved Lucy. However, I get questions from time to time on old posts. All comments to the blog come through my e-mail, and I'd like a way to respond to older posts so that I know that the person's question/comment gets addressed--and they can see that by getting an e-mail notification. They get to keep their privacy, but they get information without having to winnow their way through a labyrinth of posts.

Under Disqus, unlike Blogger, a person cannot respond directly to something that you post, rather, the comments just lie there.

This is more of a fixin to get ready to post, and not something that I've committed to yet.

Saturday, October 31, 2009

Box of Rocks Revisited:ATO


We got a nice ugly candle on this one. I do not have a position, but you can see that this is the type of activity that needs to happen to pull the shorter moving average into a cross of some significance.

I did update the sector charts for those of you with about 10 minutes of patience. Click on the resources tab.

BWA


I was in BWA as a true short a bit early. I stopped out. But elected to re-enter via JAN30 puts.

There's quite a bit of volume under this price area. Accordingly, I think that a breach might present a cascade of selling. I don't believe that autos is the sector to be in. BWA was my single best short (via puts) in 2008. It was not a crowded trade then. It is a crowded trade now.

Weapon of Choice

(Click to be transported)

If you love Christopher Walken, as I do, then you will not be disappointed by this music video. I've listened to it an embarrassingly high amount of times. I think that you will enjoy it. Blogger, Biffermas, at Slope of Hope, offered it as a musical selection and it has been a worm in my brain ever since. And...there is a lyric line: Walk without rhythm, and it won't attract the worm.... And you can tell he is having fun in this video...and he definitely has rhythm, as he is a damn fine dancer.

Friday, October 30, 2009

ATO: A Box of Rocks

While I do not pretend to have a refined eye, I do find this level of activity interesting.

For every buyer, there must be a seller. That we know is true. But that is a high volume day. Where is the support underneath? Note this also corresponds with ATO being inaugurated into the S&P 400.

Thursday, October 29, 2009

For subscribers only....

Remember to click!


In my continuing quest to add value, I will start asking the Magic Eight Ball selective questions. You can see its honesty to the following questions. That's about on par for most paid services, and you can get it here for free!

If you have personal question that you would like to ask of the Magic Eightball, you can do so here.

Edit.....Okay, I'm going to add another chart before going to bed.....

When Dividends Fail

Do click!

You've heard the oft-said with dividend stocks, "you get paid to wait". Well here is an example of what happens when the dividend get cut, "you get chopped into bait." A 27% dividend gone south.

The Woodshed

Here's a blast from the past...March, 2007

For those of you who read Bill Cara (that man is a saint!), you will know that frequent contributor MarkM infrequently self-imposes punishment of going to the woodshed.

Here's a woodshed that we can all hang out in for smokin' , drinkin' and cussin'--all of the things that promote civil discourse and social cohesion--


What I don't understand is why Goldman Sachs would come out with their own revision of GDP just one day prior to the government's doing so. I'm consigning them to the woodshed!

I sold some of my SPY calls into this AND I lightened up on some puts (XRAY, CFR, DUG calls). I also sold EDZ out of my spec account. I also thought that I had sold SMN, but apparently, that did not launch.

I was particularly angry this a.m. For the second day in a row, Fidelity had a bad feed. Yesterday OIH was not even a recognized symbol. This a.m. I had two option symbols that were not recognized. I also got a 1.59 fill on a SPY option sell that had a bid of 1.63. This is the second time that has happened. I have an expectation with liquid options that that the market is the bid. That's the second time in a week. Do not, then, put in market buys/sells even on liquid options as you may get a bad fill.

I'm wondering if today's GDP report will create a 'sell the news', or create some euphoric response. I truly believe that the market always WANTS to go up. Certainly it got some reason for that.

Time for some charts:

Here's LYBI. I found this on StockFetcher doing a scan....Your editor sold into the giant candle. The bid/ask spread was about .30 on this small stock. Not liquid, and I made a nice little profit on it on a modest holding of 500 shares @ $3.96. I sold at $5.20, though the stock hit a high of $5.60.
I guess it might be $10 tomorrow...but the wide bid-ask throughout the day was troublesome. I pocketed $600 net of commissions on a 2 week holding. I'll take that 31.3%....


I'm still holding this puppy.

I'm neutral to modestly short. Tomorrow is month end. Who knows what brooding will take place over the weekend. I still believe that we are at an inflection point where news is the main driver. In issue after issue during earnings season, we are seeing beneficent rewards and hammering punishments delivered when the good news surprises or the bad news disgusts.

I've manage to salvage my portfolio from the evils of the COST puts gone awry....but who knows what danger may be lurking?

Hope your day went well.

Are you Tooting?

From my post yesterday...........

I did hear the news (though apparently some (clearing throat) did not), that GS had revised GDP downward. Now the government number comes tomorrow. Now wouldn't it be a hoot to make you toot if the government's number is larger than GS's?

Wee in the Early Hours POst

(Yes, I should be in bed, but it's a dog thingy. While I wait for them.....)

Long time reader might remember when I shared a very personal story about my brother's suicide. Tim at Slope of Hope has had some guest posters recently. While I had no intention of being a contributor, I stumbled upon that post while rummaging around in my archives. It occurred to me that it might be a post of value. So I sent it to Tim (who I call Toshi!). It is word for word the post I wrote here (including my imprudent use of the f-word, not once but twice).

I see a couple of comments asking if I'm the Leisa who used to post on Bill Cara's blog. The answer is yes. I used to comment extensively there, on Tim's blog, Barry Ritholtz's blog and Roger Nusbaum's blog. Each of those places gave me an opportunity to write my meager thoughts. Bill Cara and Nona 2000 (who, introduced me to several blogs) were particularly encouraging of me in my efforts to start a blog. I wrote before Tim or Bill became blogging rock stars and their comments section a veritable Woodstock.

Wednesday, October 28, 2009

Fancy Charts?

Not here. We have a breach to be sure. There's lots of fancy charts, but you don't need one to see some of the 'obvious' places to look for support. I'd add that between 96 and 102.3 or so, there's a rather thin bar.

As you know, your hostess is not a trader. I had some lovely SPY 110's puts (in size for me) that I elected to peel off yesterday. Why? because I thought we had a decent chance of a bounce. I did hear the news (though apparently some (clearing throat) did not), that GS had revised GDP downward. Now the government number comes tomorrow. Now wouldn't it be a hoot to make you toot if the government's number is larger than GS's?

I had the opportunity to catch up with a fellow blogger, Iguanadon, at the Slope of Hope. What a treat it was to meet him. Here's a link to a pic if you care to take a look here. And I hope that if any of you are traveling through the Richmond, VA area, that you'll think to look me up (see my profile for e-mail address.

While I'm chagrined that I let a large put position get away yesterday, they were NOV puts, and those things can lose value fast. I did have the presence of mind to pick up some SPY MAR 95's. I currently have CFR DEC 50's and BWA JAN 30's. Oh...and DUG DEC 12 calls. I also have some NOV SPY calls....I'll hope for a bounce to unload them! I have some SDP, EDZ, FAZ (since 50, but a very small position) and SMN. I also bought some SH. I also bought some XRAY DEC

I've still cash to deploy, but I'm not brave enough to go full in short.

Tuesday, October 27, 2009

Louise Yamada Interview

http://www.kingworldnews.com/kingworldnews/Broadcast/Entries/2009/10/23_Louise_Yamada_files/Louise%20Yamada%2010%3A23%3A2009.mp3

A blogger, MariAroma, at Slope of Hope referenced this terrific resource. If you do nothing else in the next 48 hours, I hope that you'll listen to this.

I've also placed this on the permanent tab.

Highs less lows and the respective moving averages revisited.

I know that you guys are smarter than I am, so I appreciate it when you contribute. I really appreciate the great comments.

I wanted to expand a bit more on the new highs/lows, and more particularly how they can point to a waning trend.
Sleepless noted that during a significant crash, there would be some bastardization regarding new highs/lows. And, we'd expect to see the line advance.

Please note the highlighted area. What we are looking for are divergences. Divergences are nothing really more than a "heads up" to open your peepers and be vigilant. First, note that the yellow rectangle shows first a flattening of the moving average of the net difference of new highs and new lows while the index continues higher. Second, the index and the moving average moves directionally aligned. Third, we should ask? What to expect next? I'm guessing that we'd expect to see a FLATTENING of the moving averages, no?

I also wanted to talk a little bit more about trending v. trading markets. Last summer (2008), I pulled out my 3" binder of all of the StockCharts stuff that I printed out in 2005. I actually did it in a day, and I remember clearly doing it on my deck. Somehow, I had missed the distinction of when you use oscillators v. a trend. I realized that I was having a 'moment'--a V-8 slap on the head moment. (It is also accompanied by a stain of embarrassment on one's cheeks).

Simply put, if a stock is strongly trending, your moving average and the MACD are your best friends. The MACD is going to tell you whether or not the short term trend (on either a simple or exponentially measured means) is moving further away from the long term average or closer.

If a stock is NOT trending, but rather chopping about in a range, then an oscillator is your best friend. I've seen several people in various places present charts and talk about the stochastics being pegged and a down move is soon to follow. When the down move does not come, then there's mumbling/grumbling about the PPT or what have you. In a strongly trending market, oscillators can stay pegged in either overbought OR oversold territory for some time.

There's a helpful tool called the ADX, or the Average Directional Index. You can read about it here. I used to have something taped to my monitor to REMIND me to look at the ADX if I could not discern trend. If the ADX was rising, I'd look to the moving averages. If the ADX was stalled, I'd look at an oscillator.

Your handy source for technical indicators is here. Understand how indicators are crafted and what is a leading v. a lagging technical indicator (just as you ought to know those things for economic indicators!)

Monday, October 26, 2009

SPY today

Please click this chart to make larger


We're not quite dead yet are we? I'd expect the trend line to start flattening out (meaning down days to bring the average down). I'm watching for the moving averages, and we've got one more to hold or fold through (32EMA) We're still in markup and there my be one more Lazarus move.

I've enough puts to be happy if we go down, and enough longs to not be nail biting.

Perspective/Retrospective

(Here's a draft of something I was pulling together on Saturday morning...It never quite jelled. Nevertheless, I'm going to post it as Sleepless left a prescient comment that was as if he had been peering into my computer!)

~~~~~

My favorite thing to do on Saturday mornings (when I'm not doing a dog transport--and I've today off), is to drink coffee, listen to the technician on Financial Sense OnLine (R.McHugh this week), and nose around a bit.

There's a certain miasma between waking and caffeinating that I find helpful in getting things that have been marinating in my brain to raise their hand and say they are ready to get on a hot grill and sizzle.

To say that I've had a dearth of sizzling of late is an understatement. But I've an efficacious subconscious, and I know that it is working sub radar. It will choose in its own good time and schedule to 'reveal' itself to me. I'm still waiting for a revelation.

MarkM's comment below

Hi L. My model, eh? :)

Just need to watch the internals on any pullback here. Market was WAY overbought on a ST and intermediate term basis so we have the CAPACITY for a nice, big pullback maybe to the 900 level. That gap from last September was finally filled and for a technically driven market that was huge.

Watch what the advance decline line does. Watch the new lows. Etc. Is the pullback orderly or messy? If it gets messy with lots of bad action underneath, then we go to 900ish. If it's orderly, then we can base and pop this into year end and Abby Joseph Cohen gets her day in the sun (1200 on the Spoos).

Watch for basing action around the bottom of the channel. Usual pattern is then a blast above it sending the programs off to the races. That pattern needs to change to have a meaningful decline. Otherwise it's just garden variety profit-taking and re-accumulation for the next leg up. (If little ol' me is seeing this then it's time for the bulls to switch playbooks, perhaps with mid-channel switch or better yet from 5% or so below the channel.That would REALLY cream the shorts.)

Hedgies and program traders have been driving this market and they already have their number for the year so this is a dangerous time.

MarkM

inspired me to pick up my Mamis book...The Nature of Risk. I have about 100 post flags in this book. Naturally, I have some 'special' flags, too, to give a bit of a hierarchy between good and great. And one of the 'great' flags is an indicator that Mamis uses on the New Highs/New Lows. He considers this indicator one of the single best indicators of trouble...in that it signals first with a divergence. And the market, much like my subconscious, will move at its own particular pace to reveal what it has in mind. You, though, need to be mindful of its 'fixin to get ready to...." status.

Here's what Mamis says:

In the preceding chapters, you will have noticed a considerable reliance on the number of new highs or new lows as an example of a useful market-"language" statistic. The reason for this is simple: it works. No other indicator--whether readily available, as this one is every day, or not--has such a consistent success record.


Here is a chart of the New Highs- the New Lows. You are viewing a net difference calculation, and I've chosen to do this for the NYSE.


What is telling in a kick- in-the-stomach sort of way is the velocity and verocity of the March sell off. What is further telling in a rub-your-eyes-this-does-not-make-sense sort of way is that there does not appear to be any weakness in either of those two moving averages.

Here's another chart for the NYSE showing a weekly moving average (10/30/2000 through now) for the Advance- Decline.


Here's the Nasdaq moving averages of the NH-NL against the composite index price.


Conclusion? A Monty Python, "I'm not quite dead yet?"

Waters appear choppy and dangerous, but it is mutual fund year end, no? A push higher? A fall lower? We're as likely as not to see both. We are in the netherworld of "if the market doesn't suit you today, wait for tomorrow" era.

Sunday, October 25, 2009

For no other reason but because I could.....

First, if you've not stopped by Michael Davey's, Centrifugal Deforest's blog, do stop by. You can find him here:

I see that he has some interesting picks, and some of them from the Chinese bone yard which you know that I love to pick through. I posted ORS, and he mentioned that he does not buy stocks less than $2 unless the market cap is higher. It made me wonder how of the Chinese ADR's, what was the relative market cap of particular issues.

Here are the top stocks that comprise 90% of the market cap of China stocks according to FINVIZ numbers (click to read!).


PTR and LFC are almost 70% of the entire Chinese ADR's market cap. Add CHA and ACH and you are almost at 80% with just 4 stocks.

Now....if you want the entire excel file, go to the 'Resources' tab at the top of the blog, and you can find it there.

Housekeeping

As I take a break from my EPA cleanup at home, it occurred to me that I need to resurrect an Upload tab. While I adore this blog skin, I've not taken time to ferret out the CSS code to make it as usable as what I used to have. Remember those nested menus that I used to have?!

Anyway, I did manage to correctly assemble the tab above--formerly called "What's New", but sadly never had a damned thing in it.

So check there for various uploads/resources for you. I'll update the two there weekly, and I'll add to that list

PerfCharts Redux

Glenn's comment about sector performance inspired me to put together this week, month and YTD view of John Murphy's sectors for you to see relative performance among those three slices of time. I think that I'll do this more. I did note in my sector charts that biotech is looking a little ragged.


DJ Sectors_102309

Here's the PDF for the DJ Sectors for those with an interest.

http://www.box.net/shared/static/o10jp78hep.pdf

Sunday Morning Charts

I'm on my final day of slumming. I was going to take a brief nap yesterday. I find an afternoon nap a terrific luxury. In fact, I seldom sleep as well as I do in taking one of these naps. Oh...and it's not a cat nap, "power nap". It's generally a 1-1.5 hour nap. And when I wake up, I'm awake.

My three dogs seem to enjoy these naps. Unfortunately, Daisey was so excited she took her paw (and she has big feet) and managed to hit me in my eye. Luckily, there was no abrasion because of the beauty of our blink. However, but I had about an hour where I was having some real discomfort, and I was wondering whether my eyeball had been pushed to far back in its socket. The worst of it passed...but there went my nap!

I did not have a chart free day yesterday, rather, I looked at a few charts (but not TOO many). I wanted to share a few with you. The market is getting a little jiggy, and you know that I do not give recommendations on stocks. But this is a blog all about sharing my process (the good, the bad and the ugly). You should know, though, that I don't always publicly crow/lament about all the good/ugly, but I do try to to give some representations of both.

Here are some charts...remember to click to make larger.

Here is my WH...my little Chinese tubular steel maker. This stock is fixin' to get ready to do something. I've a few shares of this, and of course I'd like for that direction to be up.

Now you might be mumbling, "Leisa, just use a stop".

See the image above....If a stock gaps mightily, then your stop is pretty useless. It works for very liquid stocks. Many of these stocks that I am in are not that way. I'm not saying that you should not use stops. Merely, if you use them, understand that you can still get a huge loss. First your stop has to be triggered. Second, there's a minor issue with it needing to be filled. In fast moving market, your fill may be a long way down the price road.

The next one (another Chinese stock..you know I look at these charts most weeks!) is ORS. I've no position in this stock.


In a discussion on SOH, water treatment was mentioned. I was reminded of MWA, and I created an updated chart:


As we know, nothing in a chart can tell us about the future of stock direction with any certainty. But charts yield clues as to price performance, volume patterns, price/volume patterns (e.g. support, overhead supply). I'll go to my grave still peeking at fundamentals. I do care about them secondarily. So I'm not a purist practitioner of either fundamental or technical analysis. But if we are doing anything at all it is evaluating the weight of the evidence. Some passing understanding of the company's fundamentals helps inform of potential knowable risks (bankruptcy, patent expirations, drug trials, economic pressures). And you ought to have an idea of where the business cycle is and whether this stock is in the mature phase of that cycle or not. For regular as clockwork, money moves through those cycles.

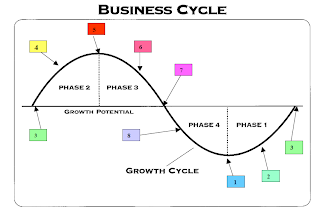
Here's PeterDag's business cycle

If you click on the graphic above, you'll see his PDF explaining this cycle. It's important information to understand....you do not want to buy good companies in cyclical industries late in their cycles.

Saturday, October 24, 2009

Bird Doggin'

Please click on the picture to view this artist's work at Art.com

Given that I'm slumming, that also means that I'm trying to connect some random dots that mean only that I'm doing my usual random pattern of "oh, this is interesting" that will lead to an "Oh!" That means Bird Doggin' in honor of my beloved Lucy. I've not flushed and pointed out anything new and interesting for you in a while, so I'm trying to make up for some lost ground.

Okay...maybe I will not get the big "Oh!", but I'm giving my starved brain some inputs from which POSSIBLY to gain some future traction that will lead to who knows what.

I was reminded to visit f. W. Engdahl's 'space' which you can find here. In doing so, I came across this series of Real News interviews which you can find here. I liked it so well I became a contributing member. You can find The Real News Network here.

A few things perhaps off your beaten path?

Give a Listen, Won't You?

One of the habits I've gotten out of the habit of of, is listening to Gary Kaltbaum.  While I adore his market commentary, I tired a bit of his political carping...so I tuned out.  But his Friday's show is spectacular.  You know that I believe that he is one of the honest voices out there.


You can listen here


http://archives.warpradio.com/btr/InvestorsEdge/102318.mp3


I have a post coming later, but it is still in my quality control department undergoing a 10 point safety check!

Friday, October 23, 2009

Slumming and Comparative Resources

The men folk took off for West Virginia for a dirt bike ride with some others. This trip is one that is much anticipated, and they try to go 2 times a year. Last weekend they were rained out. It's just me and my girls. My daughter just stepped out the door for her plans. But earlier, we took a nice walk with the canines. Lovely warm, Indian Summer evening.

Below is a picture of Malcolm Smith (left) and Ken. Malcolm Smith is in his 70's and Ken is likely in his 60's. The picture was from a couple of weekends ago from Hatfield and McCoy, where these men are still enjoying this sport called dirt bike riding.

malcolmandme

Malcolm is considered the father of dirt bike riding. It's a terrific picture of two men passionate about this sport and still engaged in it.

I'm going to make some good use of my time away from having to take care of the needs of others and get some stuff down around the house.

I'm going to spend a quite evening looking at charts. We are bumping into resistance...here's a previously shared chart.

spy_1021

There's a picture in my head that we could carve out a whomping big "W" bottom which would fit well with a gnashing and thrashing economic scenario. I wonder if we will have 1 more push up...a last gasp so to speak, or if we've already had it. Perhaps MarkM's model will tell us?

I'm pretty much of the mind that either direction would not surprise me.

Glenn asks about a quick way to see changes in sectors from week to week. One way to do this would be to use this view of the PerfCharts on Stockcharts (click on graphic to be transported).

perfcharts_Bar

Also, Finviz offers a nice graphic (click to be transported)

finviz_groups_102309

And finally, one can go to the Market Data page in the WSJ


These are my typical go-to sources to get the broader feel of the market.

test

test

Thursday, October 22, 2009

PerfCharts and Dumpster Diving

Glenn asks: Leisa, have you worked the Stockcharts "PerfCharts" into any part of your routine sector analysis?

Rather than answer in the comments, section, I thought it worth answering in a post. StockCharts is one of my favorite places in the world. My first technical analysis 'book' was the 3 inch binder that I created by printing off every TA article off of StockCharts. Reading this material (yes, I read every single article) helped direct my future reading. I have to consider John Murphy my favorite technician because of his gift of teaching. I appreciate the 'voice' that he brings to his writing, and his gift of objectivity without ego.

You can find the PerfCharts that Glenn asks about here. Here is what it looks like.

This happens to be a pre-packaged one on commodities. Over a period of time (using the slider) you can see how each group has performed relative to the other. You can also do that with stocks you are considering in a sector to see relative performance among each other.

Now to answer Glenn's question. No, I don't use them. Rather, I do it the hard way! And Glenn, if you want to share how you use these, I'd love to post it.

I really do find it comforting to look through a great number of charts through the week in different sectors--though to be sure, PERFcharts give a shortcut to that. The detail, though, gives me a 'feel' for what the underlying movement is under the market. Plus...it helps me find setups in the making.

If you are not familiar with StockCharts, then I'd encourage you to spend some time there if you have an interest.


I have no position in NSSC, but I've owned it in the past. While the pattern is constructive (a lovely base) today's volume on the bar was not very high. I had this idea (when I entered the position who knows when) that security products might be in demand due to the future social unrest that all are predicting. Personally, I have my pact of dogs that though they would not kill anyone, make enough noise to disabuse someone from attempting trouble.


I'm gonna keep my eye on this. It's a low rent stock, but for some reason, I seem to have pretty gook luck with these.

I did buy some of WUHN. Notice that the volume is only 1500 shares. I happened to be 1,000 of those shares today.

From their website:

Wuhan General designs and manufactures industrial blowers and steam and water turbines.Industrial blowers are used to move large amounts of air in applications such as power generation, coal mining, sewage treatment, subway system ventilation, and the production of products such as steel, chemicals, and paper. Relative to power generation and the manufacture of industrial products, blowers are often used both to feed air into the process and also as part of the air pollution control system that cleans air emitted from the process.

Steam and water turbines are used to generate electricity. Our steam turbines can be used in various types of power generation facilities including those that consume coal, oil, natural gas, and nuclear fuel. Our steam turbines are also often used in cogeneration facilities in which excess heat and steam generated from the manufacturer of industrial products (metal, chemical, petroleum, paper, etc.) is converted into electricity. Water turbines are used to generate electricity from at hydroelectric stations.


It's a speculative play....but this chart, to my eye, looks promising.

Ultra ETF's

For those of you who cannot get enough pleasure or pain (depending on which side of the trade you are on), I've uploaded the Ultra ETF's (long and short).

You might find these convenient to scroll through quickly......http://www.box.net/shared/static/q5515iq3us.pdf