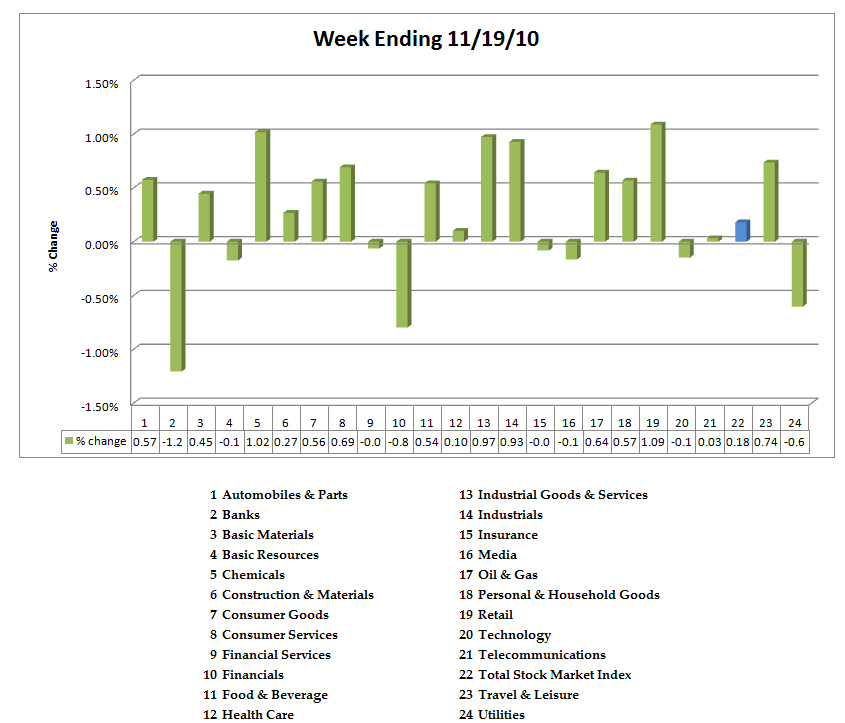
The total market index was basically flat at .15% change. Within the total market, banks, other financials and utilities were the most notable underperformers. Below is a graphic of the 23 sectors and the total market index. (Click all images to make larger).
Let's take a look at a WEEKLY chart of Total Stock Market Index that includes the volume@price bars:
The markets continue to work off overbought conditions. As we saw last week, the market is still very fragile to news that surprises regarding sovereign debt. It is also worth noting that for the first time, bonds and stocks have diverged. TLT has fallen with a falling stock market. So while the flight to safety might be in the USD, it is not going into treasuries.
I have created for you a chart book with the daily, weekly sector charts in addition to the table of 148 industries sorted by performance as well as short interest per sector. It is a large file, so please be patient with the download. You may access it
here.